The Toaster Experiment
Apparatus
The apparatus consists of a kitchen toaster; two pieces of sheet aluminum bent into the shape of a ``U''; four thermocouples: two attached to the inside walls of each of the sheet metal pieces; a data acquisition device (DAQ) for digitizing the thermocouple output; and a computer to record the output of the thermocouples. Figure 1 is a schematic of the apparatus that depicts the sheet metal toast in the toaster.
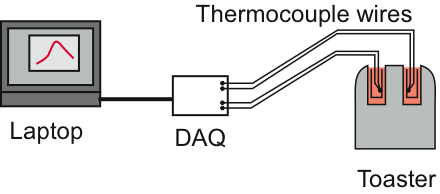
Figure 1: Schematic of the toaster apparatus.
Figure 2 is a photograph of the toaster, two pieces of sheet metal toast and a cooling fan that is used to introduce a variable cooling rate when the toast is removed from the toaster. Heating and cooling processes are studied in this laboratory exercise. The hollow of the U-shaped pieces of toast is filled with fiberglass insulation.
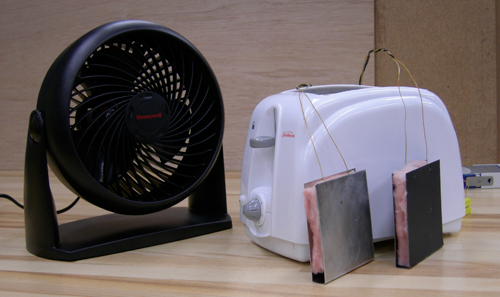
Figure 2: Cooling fan, toaster, and insulated shiny and black "toast".
There is a small possibility that with careless operation of this equipment, the sheet metal "toast" could make electrical contact with the heating elements. There is also the possibility of being burnt by the hot metal when it is removed from the toaster. Common sense and awareness of the potential for danger are necessary. For example, it is important to use pliers with electrically insulated handles to remove the "toast" from the toaster.
In-class Demonstration
The in-class demonstration takes 15 minutes, including the time to introduce the project, fill out the worksheets, and run the experiment.
We begin with a brief introduction to the EET project and then describe of the experimental apparatus. Students are asked to complete a two page worksheet that solicits their prediction of what will happen when the lever on the toaster is pressed down, which lowers the toast and turns on the heating elements. Specifically we ask whether there will be a different thermal response for the two pieces of toast. If there is a difference, will it be large or small? Additional questions concern the modes of heat transfer affecting the sheet metal pieces while the pieces are in the toaster and after they are removed.
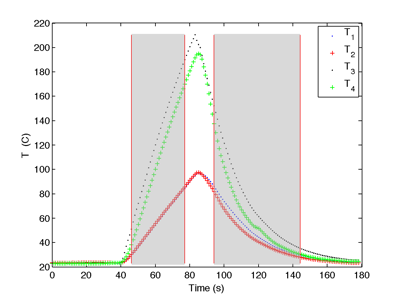
Figure 3: Transient temperature measurements in the toaster demonstration. The left shaded band corresponds to the heating stage. The right shaded band corresponds to the cooling stage.
Sample Data
On May 21, 2009, the toaster demonstration was given in the ME 323 (Heat Transfer) class. A screencast of the data analysis shows the difference between forced and free convection cooling.
Lab Exercise
The laboratory exercise takes about one and a half hours. The purpose of the exercise is to give students a guided-inquiry learning experience that complements the conventional lecture for the class. At this point in the EET research project the team is developing the laboratory hardware and learning exercise. As such, the lab exercise is voluntary and does not count toward the student's grade in the course.
The laboratory exercise involves an exploration of the effects of different thicknesses and surface treatments of the sheet metal toast. Free and forced convection cooling are also investigated.
A MATLAB program is provided for post-processing the data. The program allows the user to graphically select regions of the measured T(t) curves. For each selected region of the data, the program plots dT/dt versus T.
Figure 4 and Figure 5 are plots of dT/dt versus T for the heating and cooling phase data in Figure 3. T1 and T2 are temperatures of the thermocouples attached to the black toast. T3 and T4 are temperatures of the thermocouples attached to the shiny toast.
Note that dT/dt>0 for the heating phase and dT/dt<0 for the cooling phase. For the heating phase data in Figure 4, there is a strong separation of the data between the black toast and shiny toast. For the cooling phase data in Figure 5, the dT/dt versus T data for the black and shiny toast tend to cluster along the same curve. Can you form a hypothesis that explains why the curves should be so different during the heating phase but so similar during the cooling phase?
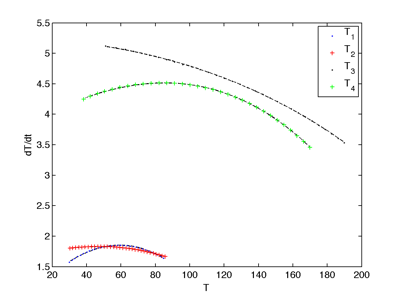
Figure 4: Plot of dT/dt versus T for the heating phase data in Figure 3.
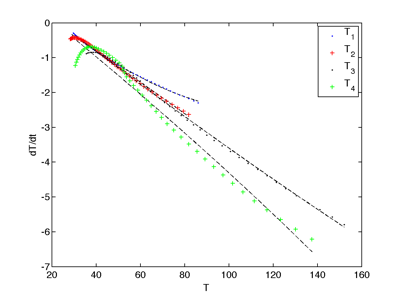
Figure 5: Plot of dT/dt versus T for the cooing phase data in Figure 3. The pieces of toast are suspended in the air downstream of the cooling fan.

|
Funded by NSF DUE #0633754. Any opinions, findings, and conclusions or recommendations expressed in this material are those of the author(s) and do not necessarily reflect the views of the National Science Foundation |